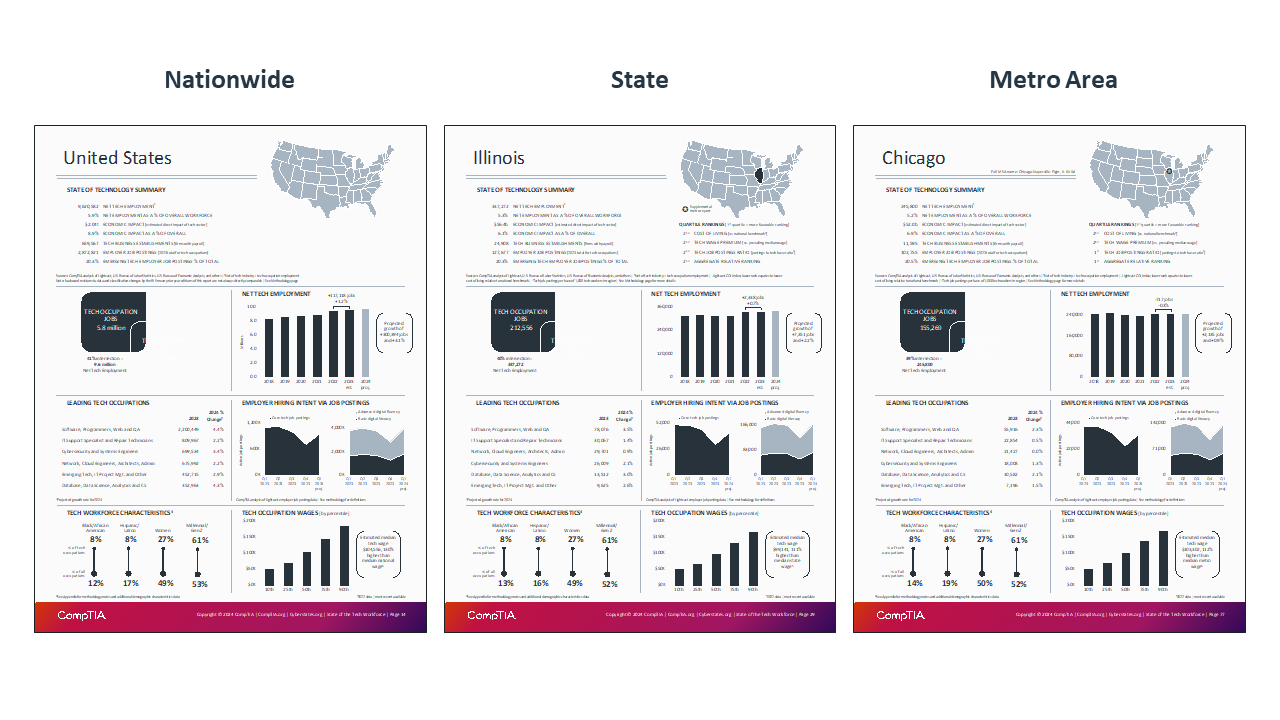
CompTIA’s State of the Tech Workforce, also known as Cyberstates, provides the definitive guide to tech workforce trends, the number of available jobs in technology, and tech industry employment statistics by state, metro area, and nationwide. The State of the Tech Workforce aggregates mountains of data and transforms it into easy-to-understand visuals and actionable insights – the digital economy at your fingertips
The tech workforce consists of two primary components, represented as a single figure by the ‘net tech employment’ designation. The foundation is the set of technology professionals working in technical positions, such as IT support, network engineering, software development, data science, and related roles. Many of these professionals work for technology companies (45%), but many others are employed by organizations across every industry sector in the U.S. economy (55%).
The second component consists of the business professionals employed by technology companies. These professionals – encompassing sales, marketing, finance, HR, operations and management, play an important role in supporting the development and delivery of the technology products and services used throughout the economy.
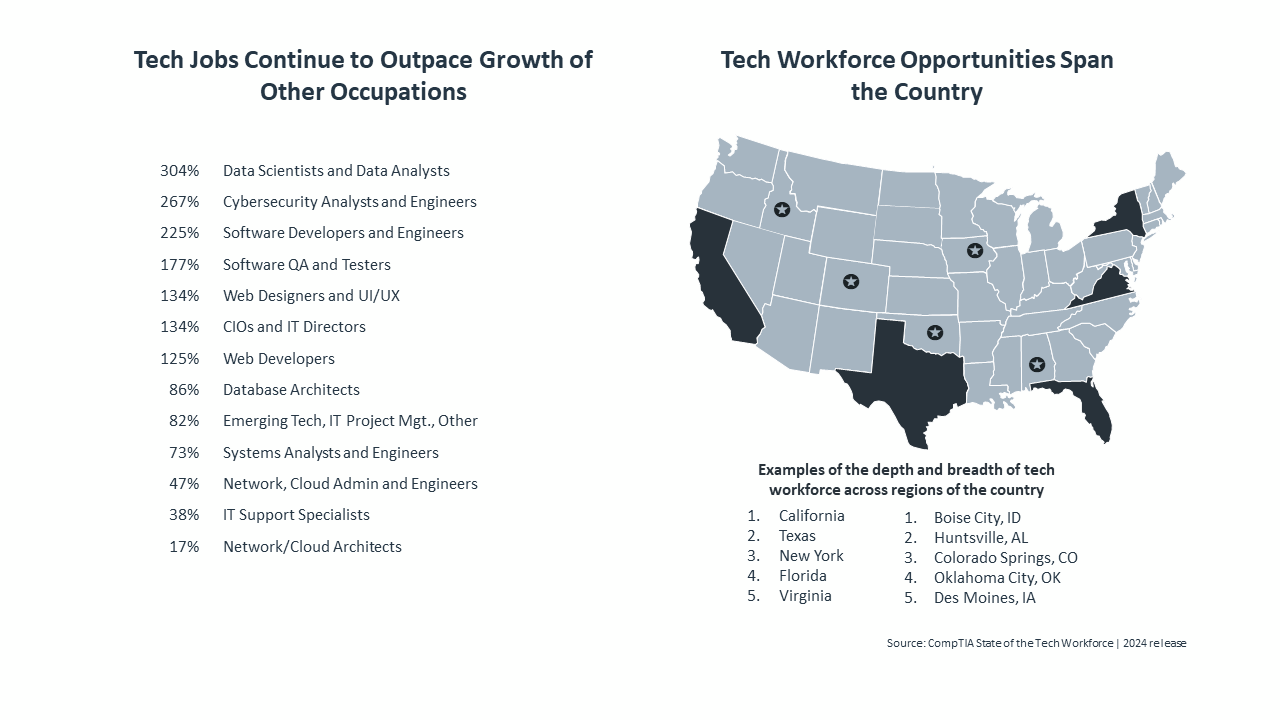
According to projections from the U.S. Bureau of Labor Statistics and Lightcast, the tech workforce will grow twice as fast as the overall U.S. workforce in the next ten years. The replacement rate for tech occupations during the 2024-2034 period is expected to average about 6% annually, or approximately 350,000 workers each year, totaling several million through 2034.
Tech occupation employment over the next 10 years is expected to grow at about twice the rate (2x) of overall employment across the economy. This confirms the relative strength of tech employment compared to many other occupation categories as companies of all sizes across every sector industry sector of the economy pursue digital transformation (DX) initiatives.
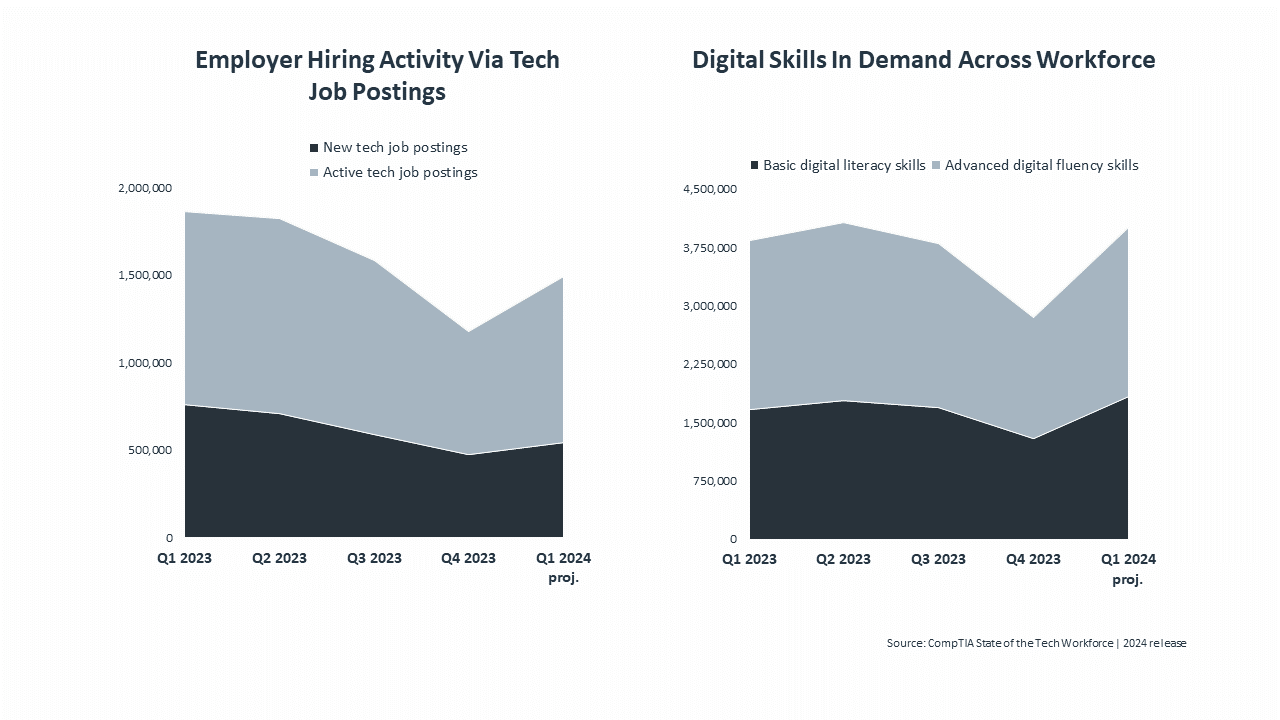
Employer job posting data provides another layer of near real-time insight into the tech job market and how companies are navigating talent needs due to growth, as well as backfilling for retirements or separations.
Job posting analysis trending reveals a dip following the hiring frenzy of 2022 before settling into a more normal range. Early Q1 2024 data indicates an uptick as employers re-evaluate hiring plans put on hold and eye growth investments requiring new skills and tech talent.
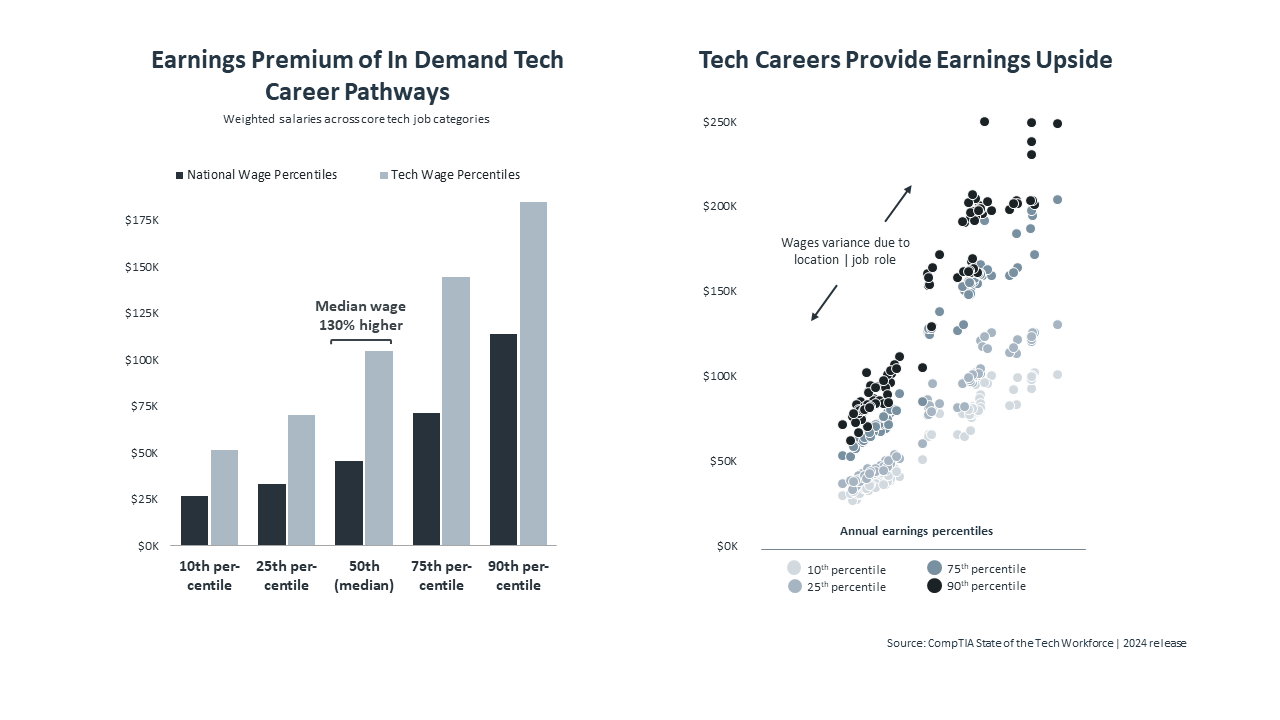
Across all tech occupation categories covered in this report, the median salary, also referred to as the 50th percentile or midpoint, was an estimated $104,556 for the most recent year of available data. This figure is more than double the median wage across all occupations of the U.S. labor force, reflecting the premium in earnings associated with in-demand tech job roles.
Percentiles help provide insight into how salaries progress throughout a tech career, with the upper levels at the 75th or 90th percentile range achieved through years of experience, training, and certifications. Of course, salary data can be narrated due to cost of living (COL) factors across regions. Please see the full report for a deeper dive into tech workforce earnings.
Please note this is an excerpt, and the full report contains more detail.
Read more about tech industry sectors.