Introduction
The growth of international trade is one of the defining trends of our time. While trade has shaped societies and economies for as long as societies and economies have existed, its impact over the past half century has been nothing short of extraordinary. During this time, trade volumes of goods and services increased 20-fold and topped $25 trillion in 2018. And yet despite this growth, we are continuously reminded of how quickly disruptions can compromise the flow of goods and services between trade partners. The Covid-19 crisis is the most striking example of late. The direct fallout could extend well into 2021 and the indirect repercussions likely much longer.
Technology plays a unique role in the international trade landscape. As a category, it represents one of the largest segments of U.S. trade. This reflects the insatiable demand of consumers and businesses for the latest and greatest in devices, applications, content – and by extension, the underlying digital infrastructure to make it all work. Additionally, as an enabling force, trade in technology goods and services creates its own virtuous cycle. The more technology is put into use, the more businesses and consumers have the tools to communicate, create, and exchange, thereby encouraging even more trade.

Overview
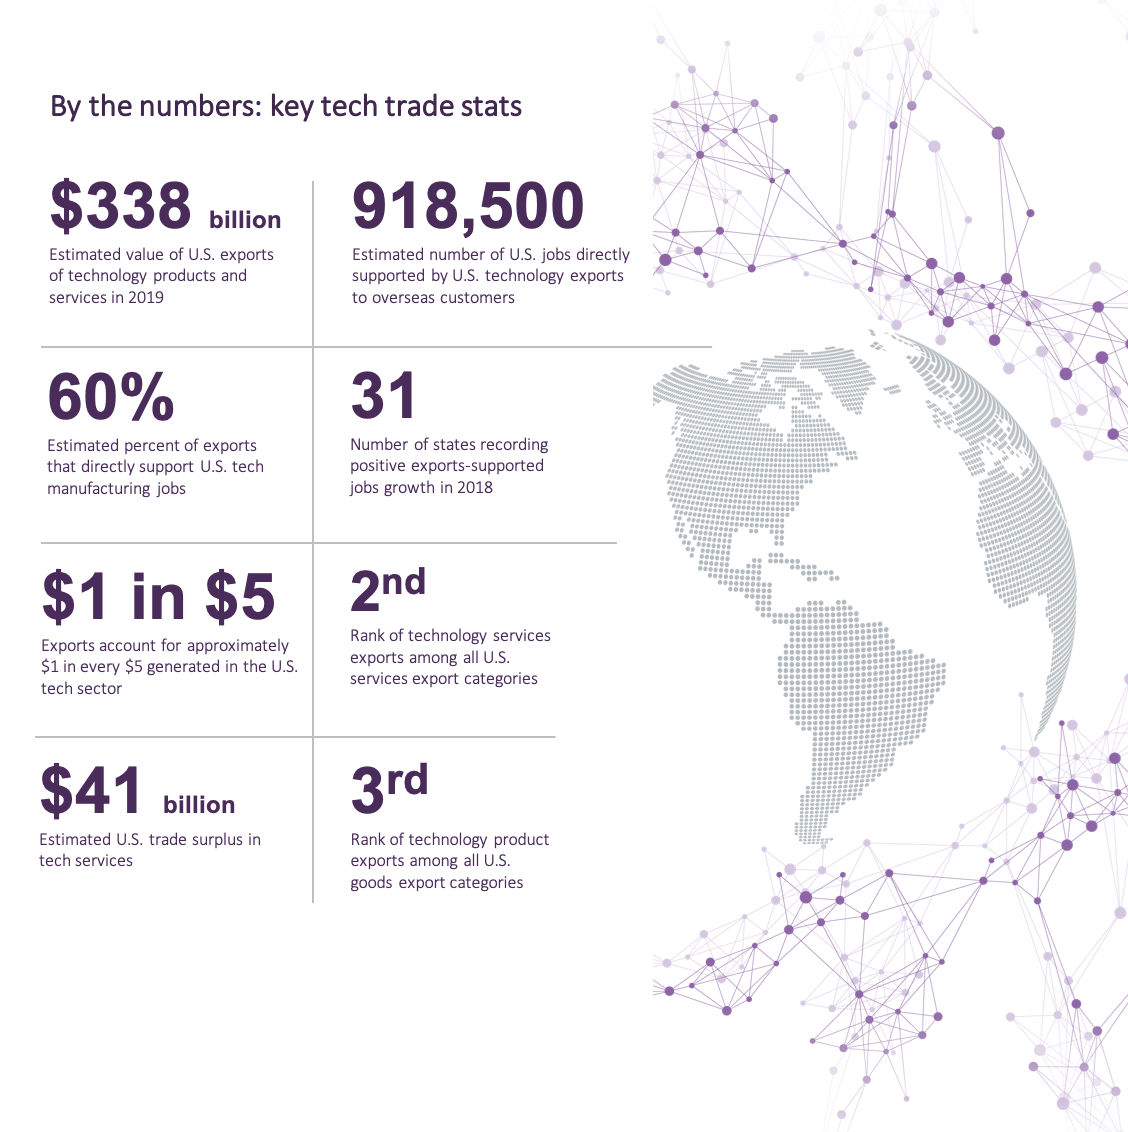
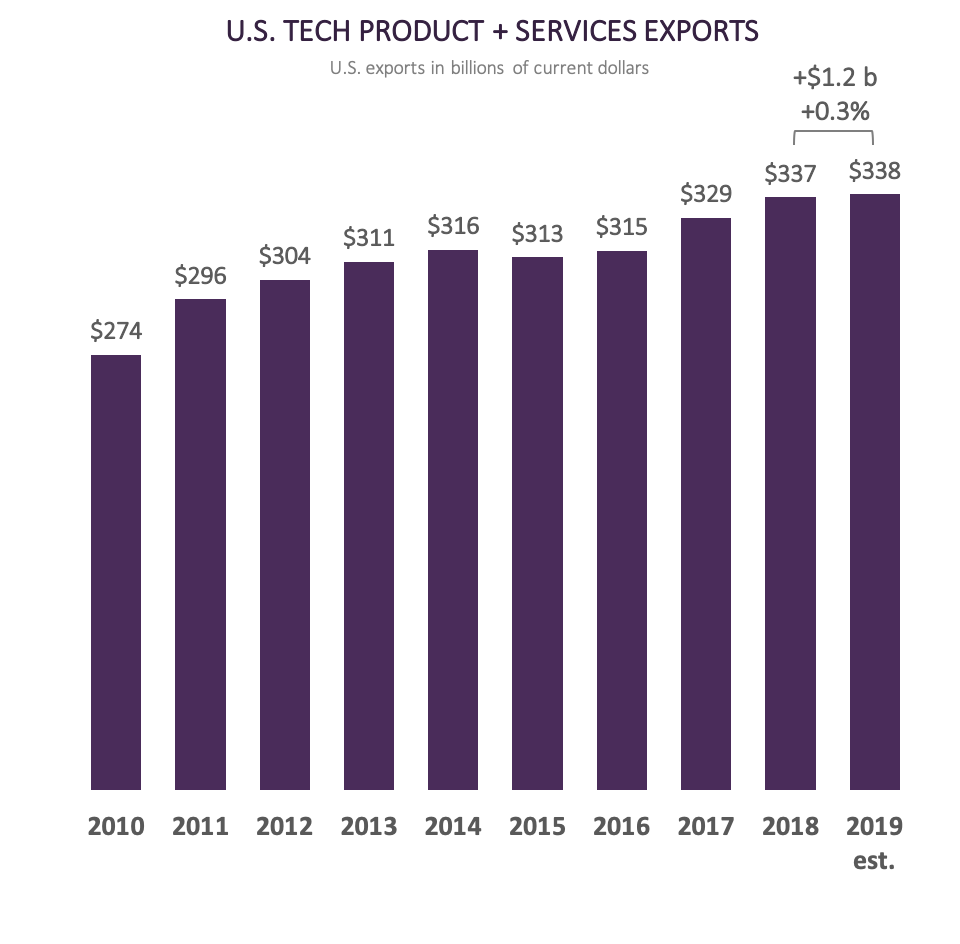
U.S. information technology exports reached an estimated $338 billion in 2019, a slight increase of 0.3 percent over the previous year. Growth slowed compared to the 2017 and 2018 rates of 4.2 and 2.5, respectively. During the decade, 2010-2019, U.S. exports of technology increased approximately $104 billion in value in current dollars, translating to 44 percent growth. Tech services were the primary exports growth driver during the decade, with aggregate growth of nearly 76 percent, compared to 30 percent growth for tech product exports during the 10-year period.
Growth in the tech sector, especially as it relates to international trade, is a function of many factors. Macro technology trends, such as the ongoing push of digital business transformation, combined with economic conditions – are customers in the mood to buy, currency fluctuations, and government trade policies all have a bearing on growth.
Analysis of the export subsectors within the technology category reveal many of these factors. On a percent change basis, the IT services subsector led all technology export categories in growth at 17.1 percent. The Information and data processing services category and R&D services category also performed well, recording growth of 15.8 percent and 6.5 percent, respectively. The growth in tech services and the “everything-as-a-service” model have been driving forces in the tech sector over the past decade. The migration to cloud platforms, the modernization of legacy applications and workflows, and the mission-critical importance of data – and soon artificial intelligence (AI), translate to demand for expertise in integration, software development, data management, cybersecurity and related competencies categorized as technology services.
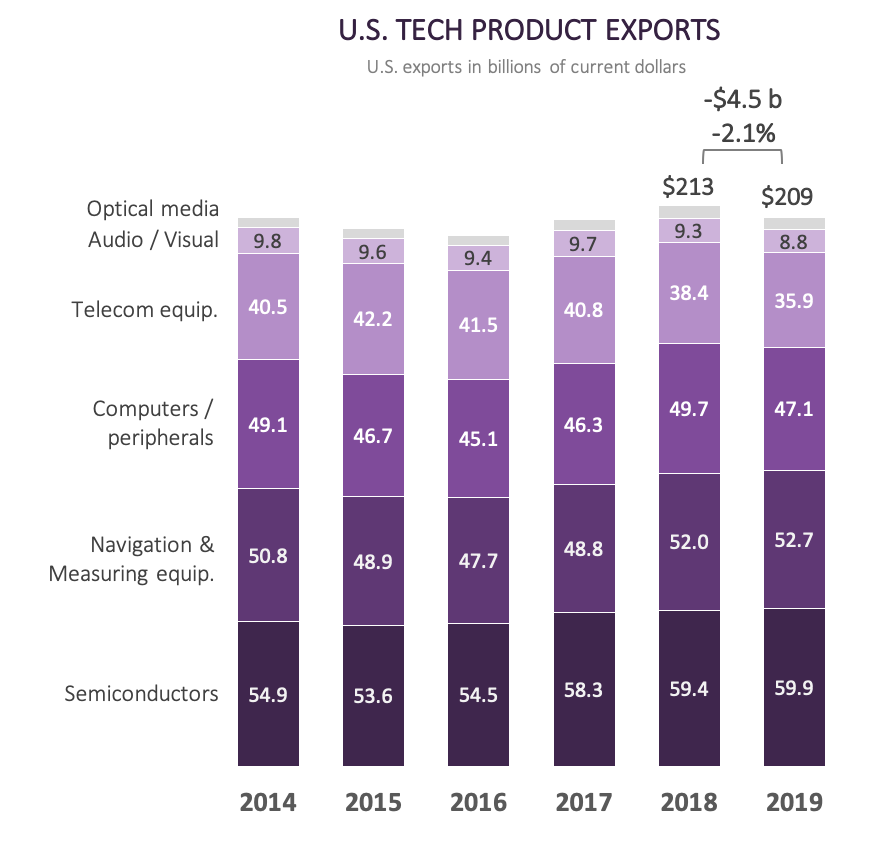
On the hardware products front, also referred to as manufactured goods, the navigational, measuring, and control equipment category recorded the highest export growth at 1.4 percent. This was followed by semiconductors and components (0.7 percent). As important as tech services, applications, and data have been to growth, these categories can only thrive when there is a large installed base of devices (think users with computers, tablets, mobile phones, etc.) and robust infrastructure that reliably delivers faster, higher capacity, and less costly computing and storage. Emerging technologies such as internet of things (IoT), edge computing, smart cities, and robotics require cutting edge processors and the components that form the “brains” of these intelligent solutions.

Like most countries, the U.S. is both a buyer and seller of technology. U.S. businesses and consumers purchased an estimated $478 billion in technology goods and services from overseas sellers in 2019. The net of technology exports from the U.S. and technology imports to the U.S. results in a trade deficit of approximately $140 billion.
In tech services, the U.S. experienced a trade surplus of nearly $41 billion. Tech services have been a U.S. strength for the past decade with aggregate exports reaching nearly $1.1 trillion over the 10-year period, resulting in a trade surplus of $336.5 billion. The software services category contributed the bulk of the positive surplus (69 percent) during this period, followed by telecommunications and information and data processing services.
In tech goods, the U.S. experienced a trade deficit of $181 billion in 2019, a gap that narrowed by 9.7 percent, or $19.4 billion, year-over-year. The largest deficit occurred in the communications equipment category, where U.S. buyers purchased $75.7 billion more in goods from overseas buyers than overseas buyers purchased from U.S. providers. The computing equipment category recorded a deficit of -$56.7 billion, followed by semiconductors at -$15.4 billion.
China accounted for 71 percent of the deficit in tech goods trade with the U.S., down from their 2018 rate of 84 percent. During the past decade, China’s share of the tech goods trade deficit has fluctuated between a high of 97 percent and a low of 71 percent. The next two largest trade imbalances for tech goods in 2019 belonged to Mexico (12 percent of the total deficit), and Malaysia (also 12 percent). See China Addendum of full report PDF for additional data and analysis covering U.S.-China trade.

Assessing The Employment Impact Of Trade
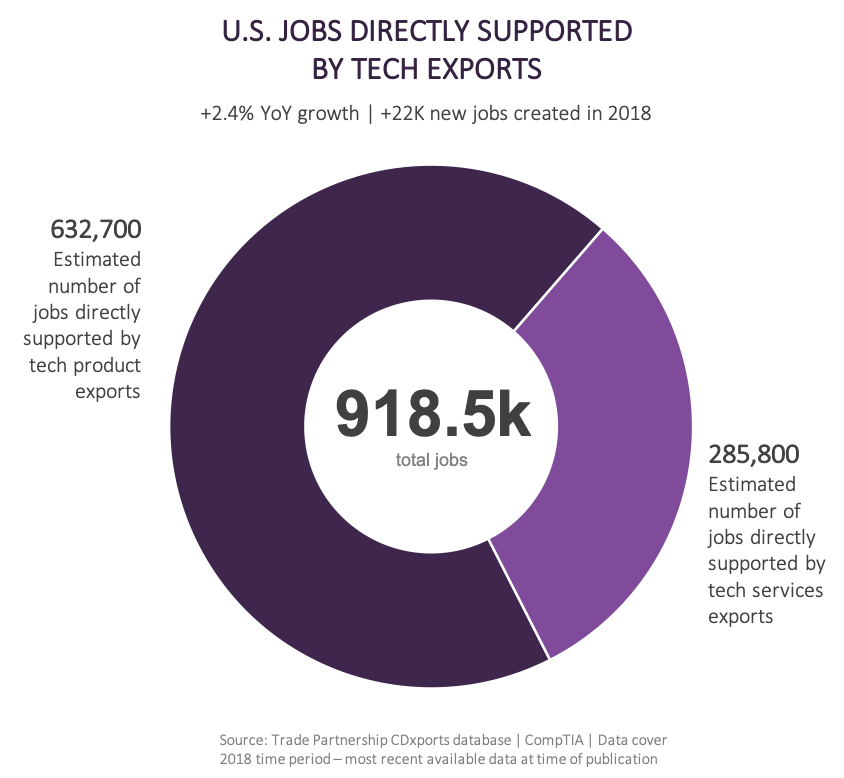
U.S. technology exports directly supported an estimated 918,500 American jobs in 2018, the most recent year of available data. During that time period, export-supported jobs grew by 21,620 positions, an increase of 2.4 percent year-over-year. Tech goods accounted for 69 percent of exports-supported jobs, while tech services accounted for the remaining 31 percent. Tech services exports boosted employment in the U.S. by 9,463 jobs, a growth rate of 3.4 percent; in comparison, tech goods exports added 12,157 new jobs for a growth rate of 2.0 percent.
Applying the average wage for these tech industry sectors to the base of employment results in earnings of over $113 billion – that is, the amount of money these workers will then spend in their local community and across the economy, including a portion spent in the form of taxes. These figures are compelling in their own right, but there is more to the story.
Beyond the direct export-supported jobs, there is an additional indirect employment effect associated with trade. Technology development requires many inputs, starting with raw materials, but also various components and software layers. Technology also frequently acts as a platform and enabler, providing users the tool to run applications, pursue business activities, or enjoy entertainment content. The labor behind these inputs or technology ‘enhancements’ is connected to trade, but not directly. This approach can be taken even further to include workers a step or two removed, such as law firms, shipping companies, marketing firms and so on. For the purposes of this report, only the workers directly supported by technology exports are covered.

Read more about Industry Trends.

 Download Full PDF